

Global Climate App
The 3D globe can be rotated and zoomed. The time displayed at the top is the current local time. The images are updated every 6 hours. The globe can be rotated around by swiping and zoomed with pinch.
Global Climate
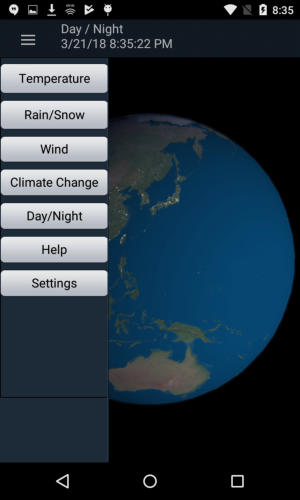


The main menu button on the top slides out
menu to choose the various displays.
The menu stays on the screen when the device is in landscape mode, and slides in and out when in portrait mode.
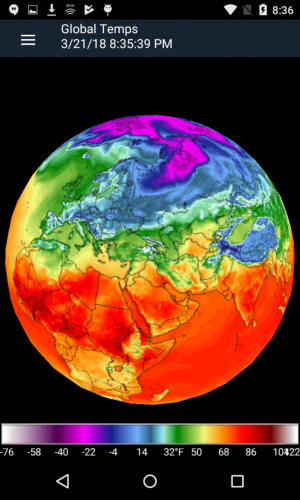
Global temperature display shows a global map
with different colors for the different
temperatures. At 2 meters above the ground.
The legend below shows the temperature for the
colors.
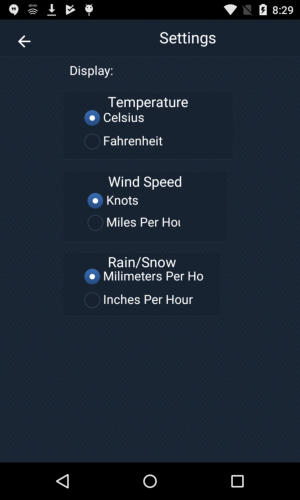
The legend displays can be in Metric or Imperial
units.
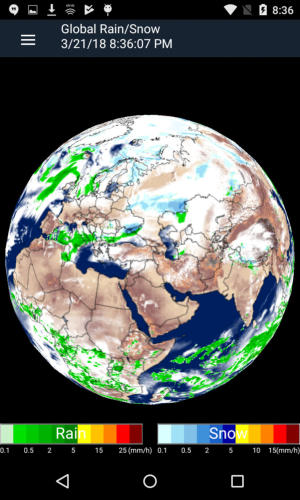
This shows current rain and snowfall amounts. White
areas are clouds. Shown in Millimeters per Hour or
Inches per Hour.
The snow level is in water equivalent - not depth.
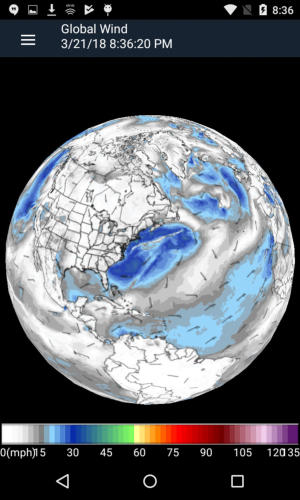
This globe shows the wind speed at 10 meters above
the ground.
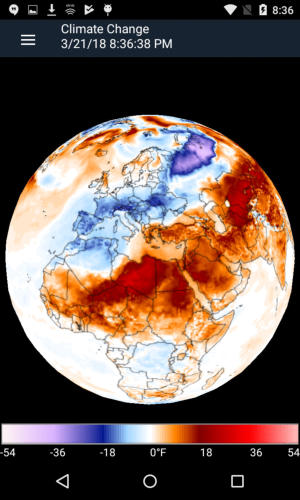
This shows how today’s temperature compares to a
past standard and will show if areas are warmer or
cooler than in the past. The temperatures shown are
deviations from the past climate baseline. So if an
area is shown as +10 degrees on the globe map, it is
10 degrees warmer than on that time of the year
from the baseline.
The baseline data for the past is a 1979-2000 climate
baseline derived from the reanalysis of the NCEP
Climate Forecast System (CFSR/CFSV2).
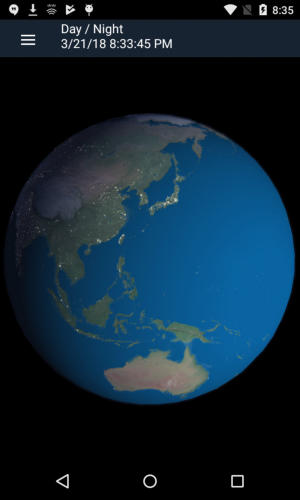
This shows the current daylight and nighttime sides
of the Earth. The city lights are visible on the night
side. Press the Day/Night button again when you
want the sun position updated.


globalclimatesetup.exe ver. 1.0.7.0 (6mb)(9/22/2023)
Download for Windows:
Download for Mac OSX
globalclimate.zip ver. 1.0.7 (6mb)(9/22/2023)
Download for Ubuntu Linux
globalclimate.gz ver. 1.0.7.0 (8mb)(9/22/2023)


Global Climate App
The 3D globe can be rotated and zoomed. The time displayed at the top is the current local time. The images are updated every 6 hours. The globe can be rotated around by swiping and zoomed with pinch.
Global Climate

The legend displays can be in Metric or Imperial units.
Global temperature display shows a global map with
different colors for the different temperatures. At 2
meters above the ground.
The legend below shows the temperature for the colors.
The main menu button on the top slides out menu to
choose the various displays.
The menu stays on the screen when the device is in landscape mode, and slides in and out when in portrait mode.
This shows current rain and snowfall amounts. White
areas are clouds. Shown in Millimeters per Hour or
Inches per Hour.
The snow level is in water equivalent - not depth.
This globe shows the wind speed at 10 meters above the
ground.
This shows how today’s temperature compares to a past
standard and will show if areas are warmer or cooler than
in the past. The temperatures shown are deviations from
the past climate baseline. So if an area is shown as +10
degrees on the globe map, it is 10 degrees warmer than on
that time of the year from the baseline.
The baseline data for the past is a 1979-2000 climate
baseline derived from the reanalysis of the NCEP Climate
Forecast System (CFSR/CFSV2).
This shows the current daylight and nighttime sides of the
Earth. The city lights are visible on the night side. Press the
Day/Night button again when you want the sun position
updated.


globalclimatesetup.exe ver. 1.0.7.0 (6mb)(9/22/2023)
Download for Windows:
Download for Mac OSX
globalclimate.zip ver. 1.0.7 (6mb)(9/22/2023)
Download for Ubuntu Linux
globalclimate.gz ver. 1.0.7.0 (8mb)(9/22/2023)